Analytics
See how many people view, start and finish your forms, and where they leave.
Plan: Business
Open a form and click Analytics in the builder's left menu, or choose Analytics from a form's menu on your dashboard. Choose the last 7, 30 or 90 days, or all time. The Edit, Responses and Analytics tabs at the top move between a form's pages.
The funnel
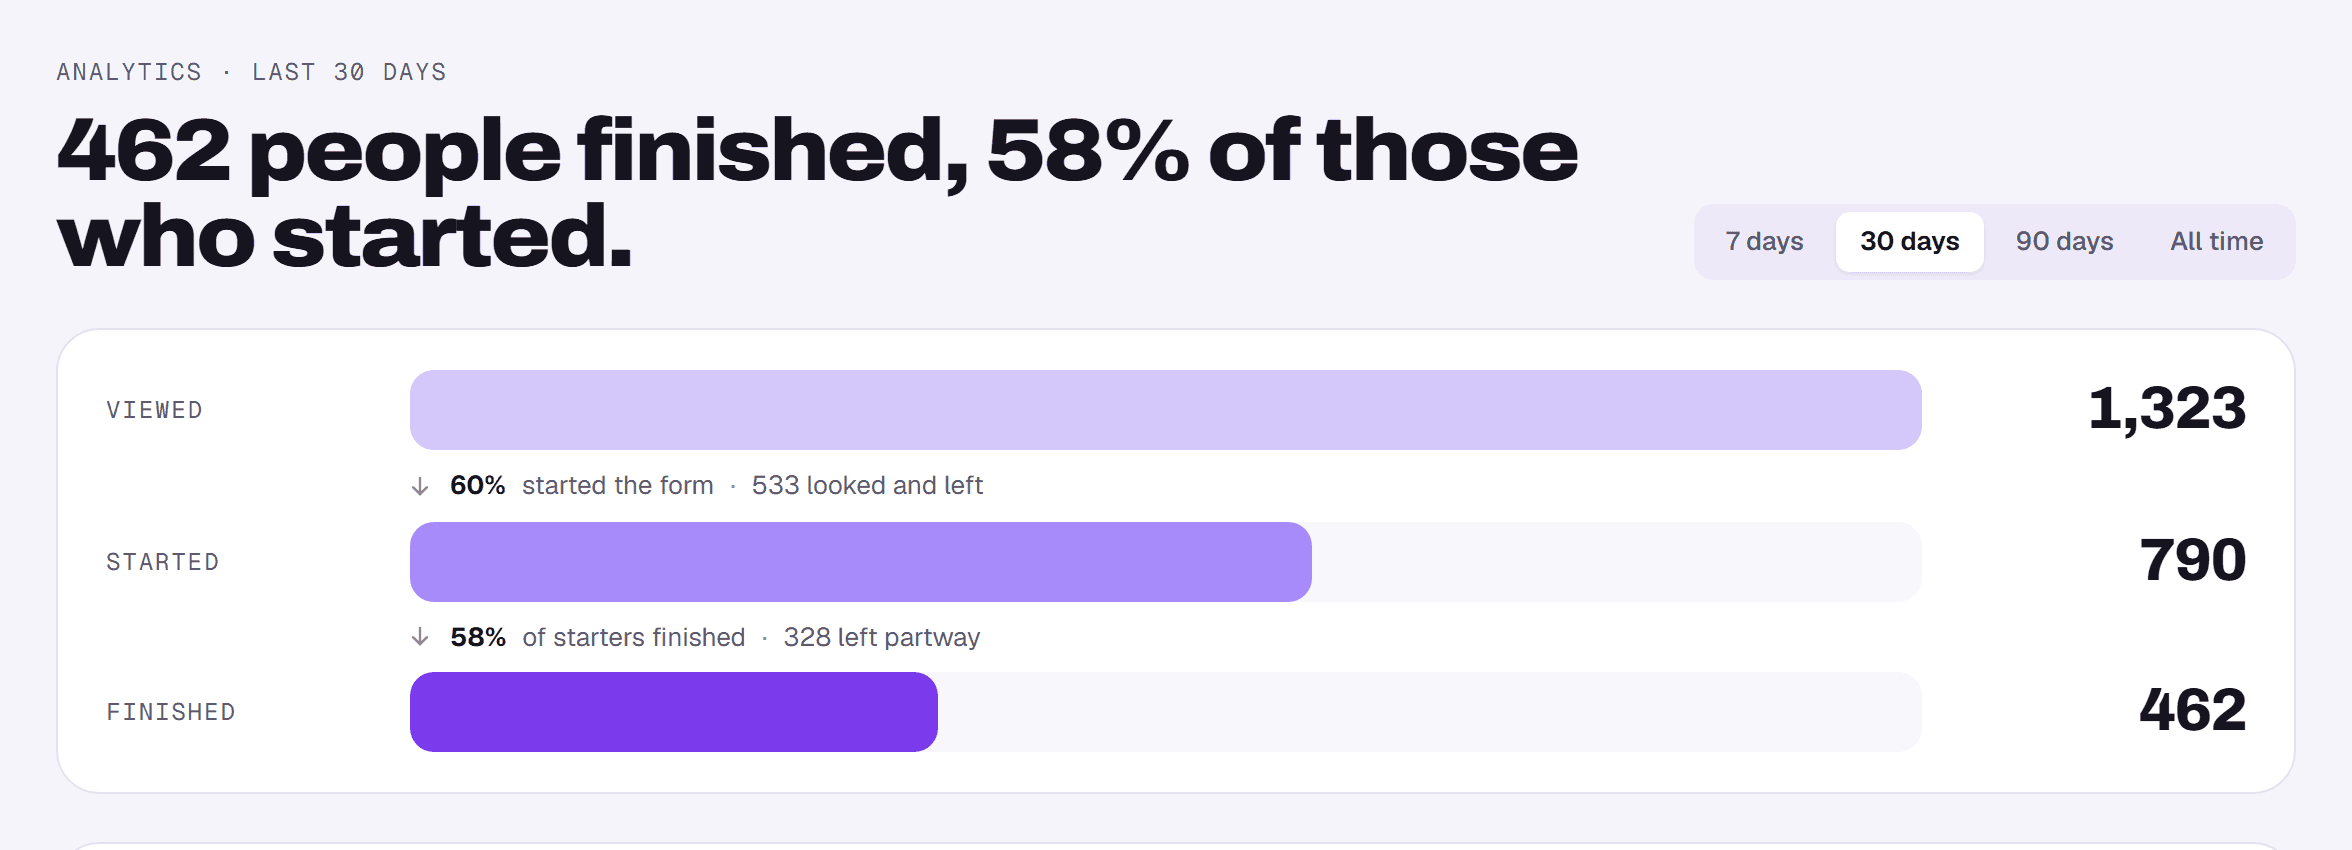
The top of the page sums up the period in a sentence, then shows three numbers: Viewed (people who opened the form), Started (people who answered at least one question) and Finished (people who submitted). The chart below shows any of the three per day.
Where people leave
For forms that show one question at a time, a table lists each question with how many people reached it and how many left at it, so you can see which question loses people. For forms that show all questions at once, you'll see how many people answered each question instead.
All your forms at once
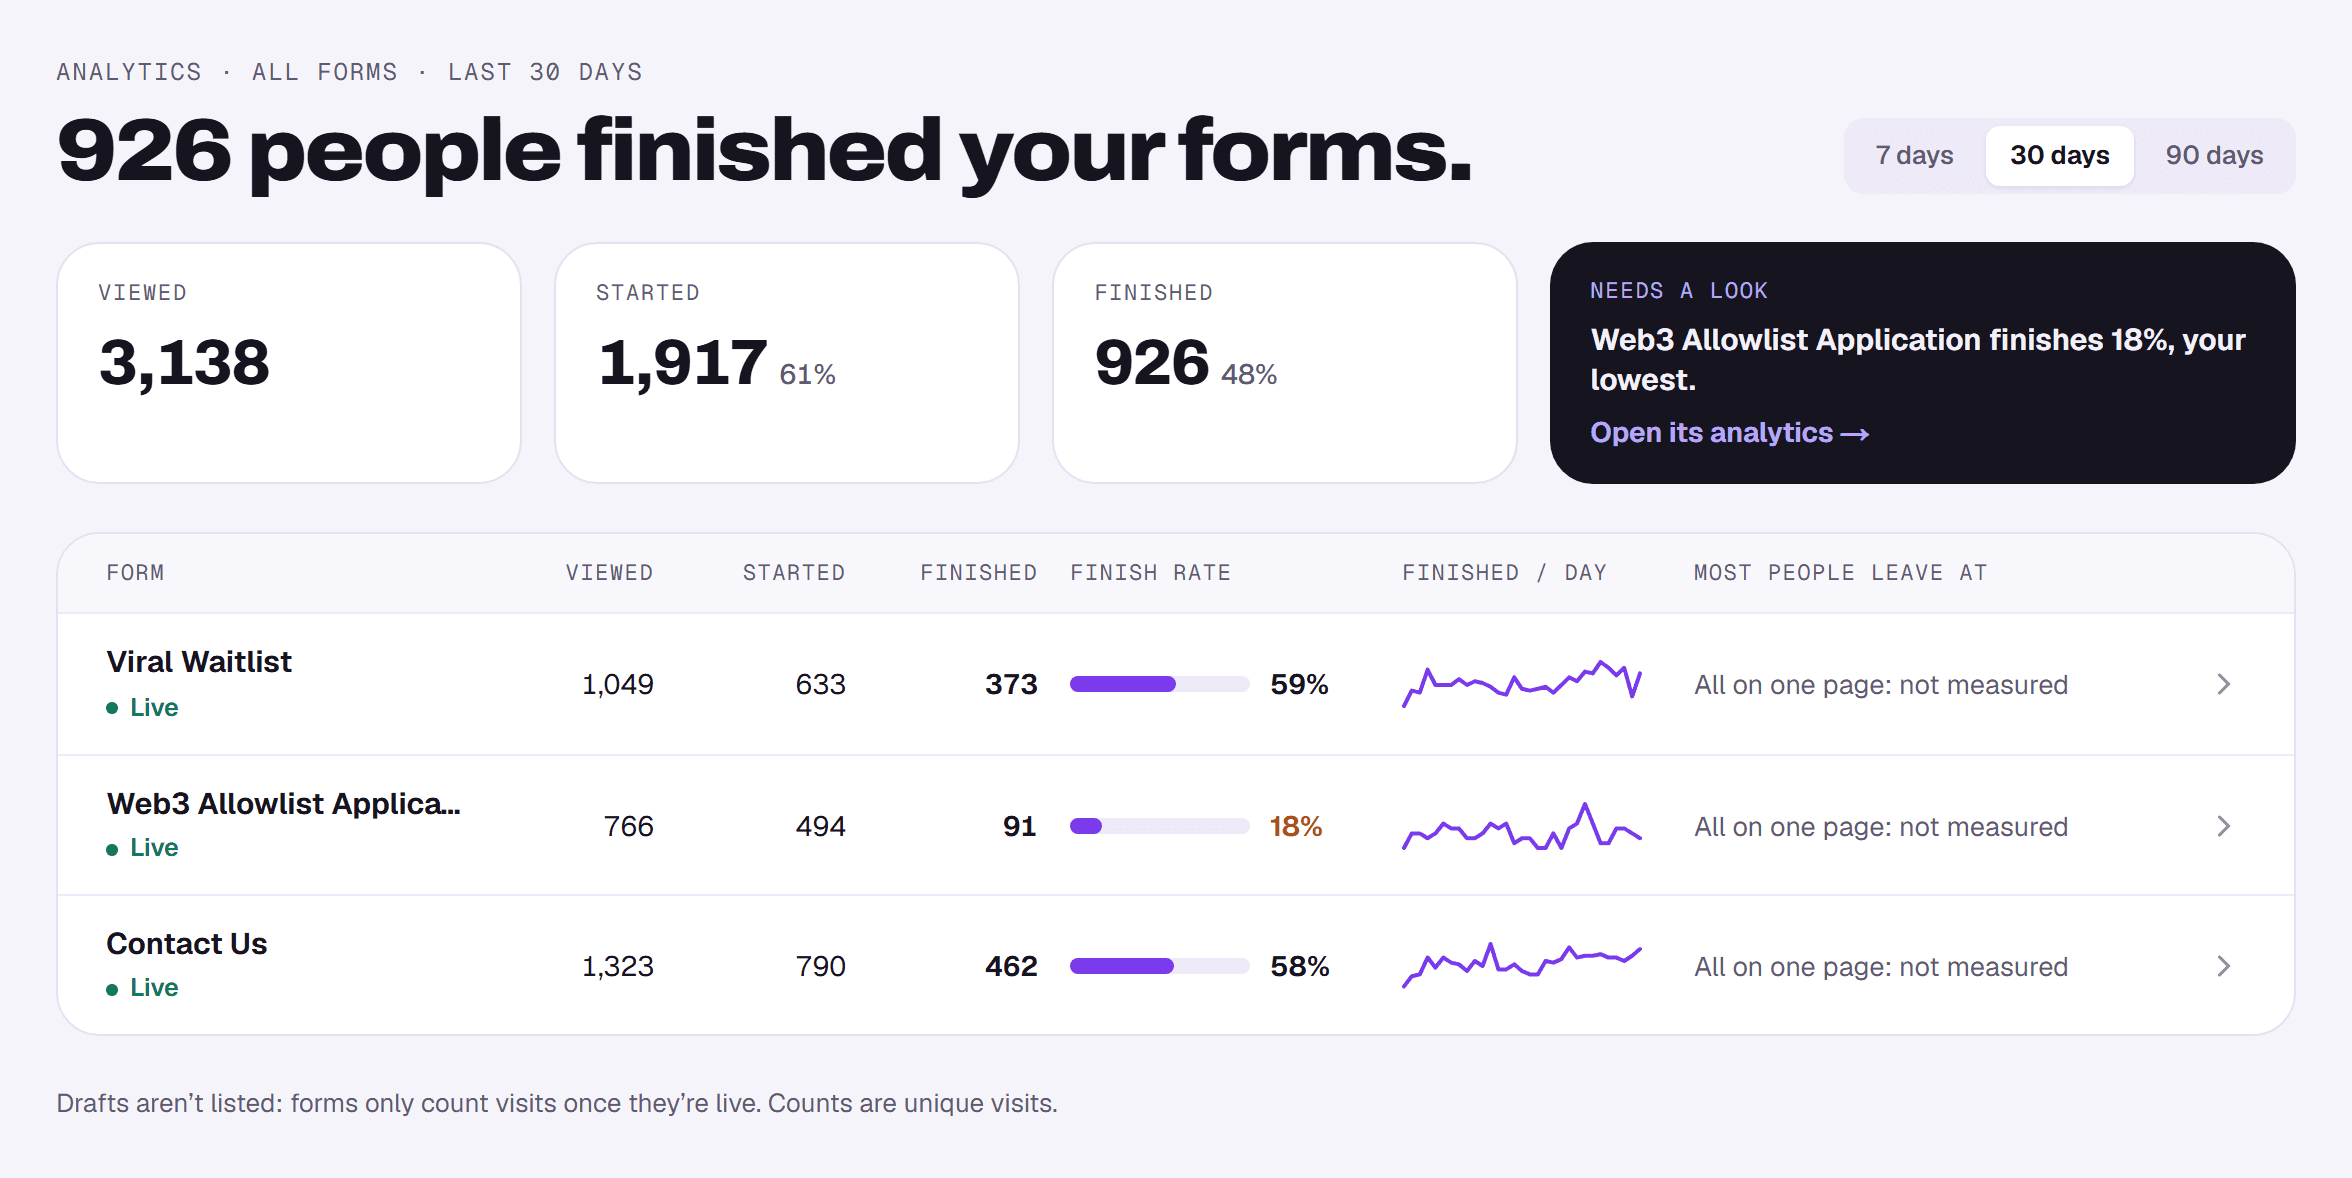
Choose Analytics from the menu under your photo, top right, for a page comparing all your live forms: views, starts, finishes, finish rate, and the question where most people leave. Forms that need a look are flagged at the top. Drafts aren't listed, because visits only count once a form is live.
On Starter and Pro
Formz counts visits to live forms on every plan. On Starter and Pro, the Analytics page shows your real view count for the last 30 days, with the rest of the report behind an upgrade. Upgrade to Business and the full history is already there.